Our Focus

Our goal is to support measurable change in mental health and wellbeing services, through a collaborative and evidence-based approach. Our clients tell us they need good visibility and value extra support to go from A to B.

Why Our Clients Choose Us

Subject Matter Expertise

We speak your language and know what good looks like.

One Team Working

Supplementing not substituting your internal resource to secure locally-owned change.

Critical Friend Support

We build trust with our sponsors, a partnership that allows us to address early issues that threaten the pace and success of projects.

Data Engineering

Making sense of scattered and disparate datasets, overcoming poor data quality, so we can unlock the power your data holds.

Lean Thinking

Our Lean practitioners and coaches know how to aid service leads to reengineer ways of working to release time to care.

Insight Generation

Our analysts provide the actionable insights and reporting to preserve a focus on high impact interventions.

Client Testimonials

The VOT team have a long record of client success.

Insights and News

Why is there such wide variation in mental health bed usage?  

Mental Health trusts recognise the need to ‘left shift’ support away from wards and into community settings.   This is often framed as a whole system challenge involving social care and wellbeing partners, both NHS and non-NHS organisations. 

It is interesting then that per capita social care spend and the level of a mental health provider’s control over community health services has no correlation with mental health bed days.

Read more

Management focus

Management teams are right to be concerned that funding allocations align with population need.  The focus, however, needs to be service design and operational rigours.

It is variation in Acute pathway flow optimisation that is separating high from low bed users.   Some trusts have a significant gap to close on peers.

What is the level of bed use variation by trust?

It is currently possible to analyse FY2024/25 data across the populations served by Mental Health trusts in England.   Our analysis focuses on the working age Acute pathway, we have included PICU bed days to facilitate comparability across trusts.   We know from experience PICU thresholds differ and service users can often become stuck in a PICU ward awaiting step back down to an Acute ward.

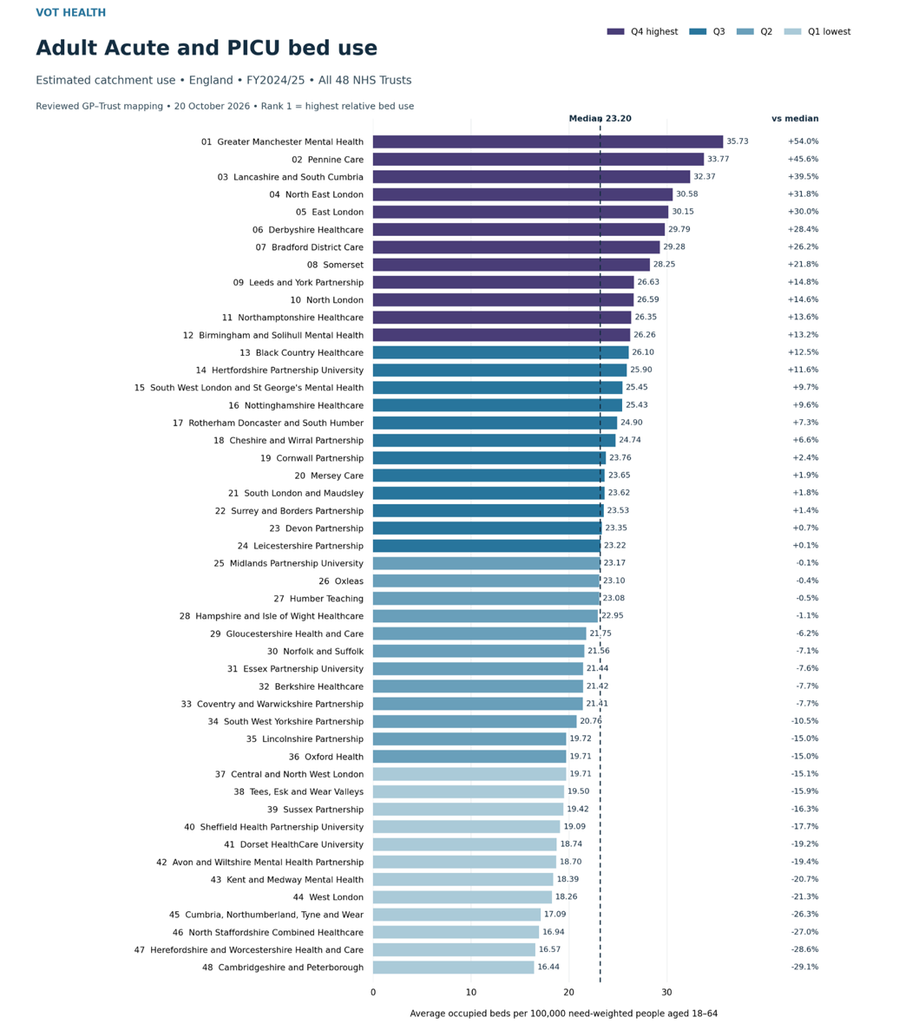
The chart below benchmarks every trust’s bed use by its working age weighted population.  A trust’s bed days are those that relate to its catchment area, it includes days spent by its catchment population in another provider’s beds and excludes other providers’ service users bed days.  

The median is 23.2 occupied beds per 100,000 needs-weighted 18-64yrs population1.   Trust variation from this average ranges from +54% (Greater Manchester) to -29% (Cambridgeshire and Peterborough).   The top 3 bed users by needs-weighted population are trusts in the North West.

Chart 1 – Benchmark
So, what is driving this variation?   There is no obvious separation by location or whether the mental health service provider also assumes responsibility for community health services in its geographies.

Social care spend does not correlate with bed usage

Social care spend on mental health by weighted population can be mapped back to provider catchments. Spend ranges between £14.4 to £57.1 per person (median £36.54) across the 48 Mental Health trusts2.   

Given discharge delay is an oft quoted challenge, it might be expected that high bed usage is related to low social care spend but this is not the case.   There is no statistical correlation between weighted per capita social care spend and beds days.

This is not to say that social care investment does not matter, how the money is spent appears to be part of the pathway improvement challenge.   From experience, there is often a mismatch between local authority provision and the type of support needed to facilitate discharge, such as specialist supported accommodation.

Trusts sometimes address a provision gap by spending monies from their own NHS budgets to commission step down beds to accommodate medically fit patients awaiting accommodation.

Population need does correlate with bed usage

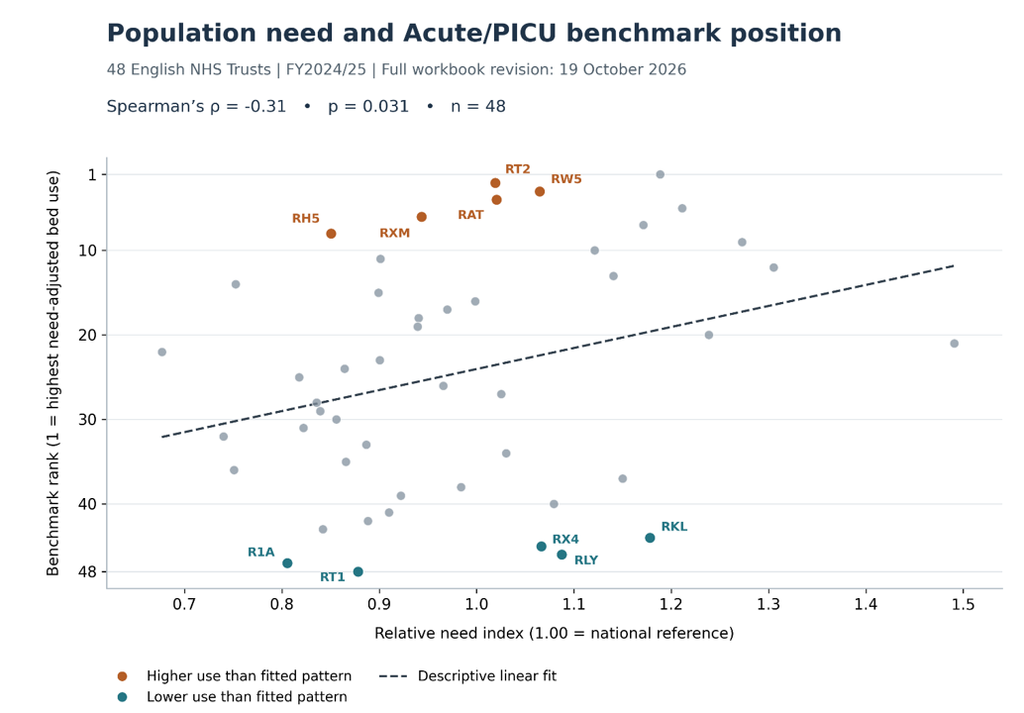
A higher relative need factor for a trust’s catchment population is likely to translate into higher need adjusted bed usage.   Noting this correlation is modest not strong.  

Chart 2 – Correlation
Operationally, we know that complex patients form the tail of long stayers that drive up average length of stay.   Prima facie the need index may not be sufficient to reflect the needs of the most economically and socially challenged.   Mental Health trusts too often find themselves holding inpatients whilst dealing with wider social and accommodation needs.

What’s interesting are the outliers in the chart above, i.e. those trusts labelled with higher or lower bed usage than might be expected for a particular population need.

What can we learn from the exemplars?

The four outlying trusts that we can perhaps learn from the most are listed below:
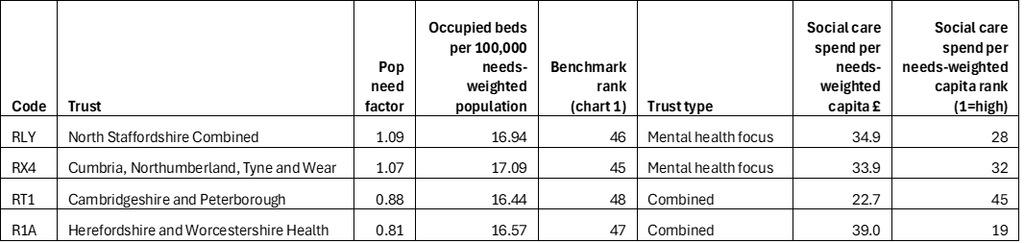
These same trusts also rank in the bottom 4 places of the bed use benchmark (chart 1).  So, what stood them apart in FY2024/25?  Desktop research highlights some common features:

  • Strict gatekeeping of beds

All these trusts stress the control given to CRHT teams to gatekeep their acute mental health hospital admissions and provide intensive home treatment as an alternative.

  • Proactive flow management

This takes different forms to expedite discharges from wards.   Common themes include the active support of CRHT or community teams to facilitate early discharge; & senior clinical review to ensure purposeful admission and to address delays for patients with extended stays.   The result is that trusts in this cohort report nationally low length of stay, half the level of the national average at times for FY2024/25.

  • Admission avoidance

These trusts flag the transformation of community support to avoid admissions.   Post-discharge care and relapse planning to reduce readmission has been a focus.  As is improving emerging crisis monitoring and a swift co-ordinated response to prevent a future admission.

Cambridge and Peterborough during FY2024/25 became the first mental health trust to establish a virtual ward, which is providing Clozapine initiation safely at home instead of on the ward.

  • Crisis alternatives

This cohort of trusts all provide some sort of crisis alternative setting; this might be a crisis house; crisis pod/lounge; haven or safe space.

Conclusion

We hope that this analysis provides helpful insight to management teams battling with demand pressure on beds.

In our view, there is no substitute for getting onto the frontline to walkthrough the Acute pathway to truly understand the scope for improvement.  Benchmarks are just a call to action.

FY2025/26 figures will soon become available, expected Jan-27.   Please look out for the refresh, as we track which trusts ‘left shift’ the most.  

Some trusts, of late, have achieved sharp reduction in out of area placements.  Corresponding improvement in the occupied beds per 100,000 needs-weighted population metric would confirm model redesign success.


Footnotes

  1. Source: FY2024/25 Mental Health Bulletin, Chapter 4, in-year occupied bed-days by patient-home Sub-ICB location and adult acute bed type – Bed type 200 Acute Adult MH plus 202 Adult PICU; exclude 201 Older Adult Acute.  106 Sub-ICBs mapped to providers, in 22 cases the sub-ICB covers multiple providers, so bed days allocated by share of weighted population.  For 7 sub-ICBs a significant no. of bed days are being allocated across providers, this affects the robustness of benchmarking for 10 of 48 trusts, seven in London (all except SLaM); Devon Partnership; Berkshire Healthcare; & Surrey and Borders. 
  2. Sources: NHS England 2023/24–2024/25 allocations spreadsheet D (mental-health need), GP need weights age/sex weights; NHS digital monthly publications of patients registered at a GP practice.  Weighted-need population measure: Sum of mean practice counts × published age/sex weights, normalised across all England practices.  Every GP mapped to a provider.

3, Nov, 2026
Rob Stafford
Sheffield Health Partnership reports zero Out of Area beds

All Trusts recognise that placing service users Out of Area represents poor care quality because it dislocates the patient from their local care network.  It is also high cost, Sheffield Health Partnership (SHPU) was spending many millions on placements classed inappropriate because it could not find space within its own wards.  Money that cannot then be spent supporting others in need of care.

We are really pleased to share that SHPU has brought down its OOA bed overspill to zero partnering with VOT.  Acute OOA bed usage was averaging over 30beds a year ago.   The Trust has been a top-3 OOA inappropriate placement user during 2025, so this represents an enormous improvement in the design and management of its Acute pathway, without compromising patient safety.

Read More

Case study detail can be found here.

NHS England have also recognised Trust success within its ‘best of the NHS’ pages https://www.england.nhs.uk/the-best-of-the-nhs/driving-productivity/engaged-staff-and-integrated-care/

28, Jan, 2026
Rob Stafford
How improved patient flow has meant no out-of-area placements for two years

CNWL’s COO, Graeme Caul, describes how it achieved long standing OOA placement cessation to HSJ.

Central and North West London utilised our market leading mental health visibility support. As Graeme describes “there is no shortcut to improving acute mental health care. But there is a formula: understand your demand, know your patients, and bring clinical and operational leaders together to act with purpose – every day of the year.” “We began by really understanding our data”

VOT staff developed the pathway visibility local decision makers needed at CNWL to “hold a weekly whole-system event that brings together clinical and operational leaders from across the trust to review data, examine trends, identify delays, and agree on the actions needed to keep the system moving. It’s a model that combines real-time responsiveness with strategic, cross-system insight.”

Read more via the HSJ article link https://www.hsj.co.uk/quality-and-performance/how-improved-patient-flow-meant-no-out-of-area-placements-for-two-years/7039421.article

21, Jul, 2025
Rob Stafford
What’s the secret to surgically removing cost from a Mental Health Trust without compromising quality?

The annual budget setting cycle is often seen by NHS services as an opportunity to ask for more not less.   With funding restricted NHS Trusts must work with a very different mindset.

The Finance Director can get the red pen out to seek to control spend but this approach is not sufficient to sustainably balance the books.

The secret is operationally-led financial improvement.

Read More

The answer isn’t more

Good operations look after the money, it is in the frontline that the vast majority of spend occurs and this is mostly people costs.

All mental health trusts have rapidly increased workforce in recent years.   They are typically one of the biggest local employers.   You will be surprised then what a small proportion of clinical staff time is spent on direct patient care.  

We often run exercises across teams to get staff to detail how time is spent to identify prime opportunities for improvement.  By way of example, a home treatment team’s nurses might average 25% at best directly supporting patients face to face or on the phone.   The majority is consumed by administration and travel.     

Ok, so some administration and travel time is reasonable, but the issue is that staff across the many mental health trusts we’ve worked with don’t know what good looks like; nor are there strong performance controls in place to drive behaviour.

In our home treatment example, staff were only with a patient mid-morning & mid-afternoon as they started and finished at base to plan for the day and access computers to write up notes.  

This is a very inefficient use of time, staff recognised that a more modern approach would be to work peripatetically remotely enabled by technology to much increase the ability to see more patients.  We were able to increase direct care time by a third.

So, extrapolate this across a Trust.   Anyone will tell you how difficult it is to recruit more mental health staff, have you first released the huge gain by using what you’ve got already via a focus on operational rigours?

Community services

PROM measures are still immature and not yet central to decision making.   When they are available they can show that the service has not made a significant difference to wellbeing.  

Only talking therapies has established recovery targets and linked package of care clarity.   This means a mental health trust will have hundreds of staff in community teams that have grown rapidly but not on a firm efficacy and efficiency foundation.

Efficacy measures are absent like step-down recovery rate and trusts are normally poor at combining activity with the workforce that delivered it to understand value for money measures like cost per case.  

The focus is largely on contacts per WTE, which has little meaning if the treatment value of the contact is unknown.  Contacts will often be just ‘check ins’ particularly when services are ‘holding’ patients because they are risk-averse &/or have no organised themselves to deliver time-limited interventions.  

This ‘holding’ common in the likes of a CMHT massively increases cost per case and demands more staff to meet the needs of new referrals.

Wards

Wards too have a similar issue.  All mental health trusts are working to ensure purposeful admission in the first instance.   You’d be surprised to note that at anytime 1 in 3 or more of inpatients are repeat admitters in the prior 12months, multiple admissions are common.    This is containment not treatment.

Ward stays also become extended, adding further to the need for high cost beds.   Facilitating early discharge demands close working between ward and community teams especially home treatment.  This like 7 day working  is still a challenge for most trusts to expedite flow.

Effective financial control

Budget planning is difficult, there is a reason why so many trusts struggle to balance the books, key reasons include:

  • Forward visibility of funding and need to balance books at a system-level.   How do you know a service development today is affordable next year?
    • Quality will always trump money.   A poor CQC report or service user tragedy will trigger a spend response.   A senior manager is much more likely to be moved on for a quality over an economy failing, as the former has much more of a hold on the public.
    • Finance and BI partnership at a service level is not strong.   Even when there has been the investment in partners to guide the effective use of resource, this is undermined either because:
      • the business partners are working too remotely from the frontline…and have not built the relationships or understanding of services to challenge clinical and operational leads; or
      • the underlying data structure and cost centre hierarchies to align workforce and activity is not in place to facilitate value for money insights

    Is it any wonder that Finance Directors will look to reserves and unfilled vacancies to balance their books, whilst cost improvement programmes (CIPs) schemes, unloved by clinicians, go undelivered.

    There is another way…

    Don’t talk about the money

    Get it right first time, good process is our friend.   We must ensure service models are clear with a focus on removing from process and pathways non value-adding activity.

    In a mental health environment this means service models that are:

    • Time limited
    • Co-produced around need (not what we can do)
    • Joined up, so across different teams all can see:
      • who knows the patient best;
      • how their need is being met; &
      • what to do in a crisis

    And ensuring process improvement, such as applying Lean methodologies, are a core competency.

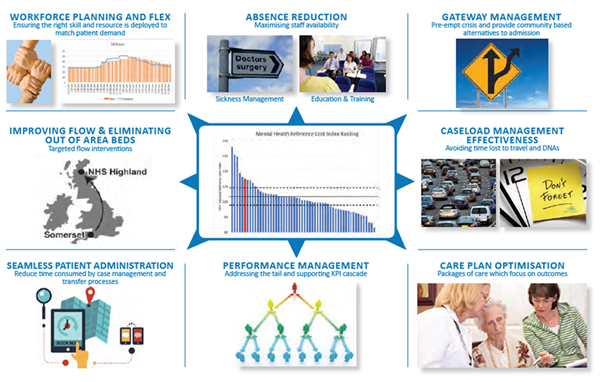
    The drivers of efficiency are not hard to list, I call this my mental health ‘wheel of fortune’.

    Wheel of fortune

    I have already touched on time lost to patient administration or poorly designed process; teams ‘holding’ service users with an absence of time limited intervention is a failure to care plan optimise.  The ‘wheel’ additionally includes workforce planning and flex; performance management and absence reduction.

    Conversations that focus on doing ‘wheel’ things better will energise clinicians.   Money discussions can, however, suck the life out of a room.  So our advice is leave CIP quantification to the finance partner to work up offline!

    Back office

    This leaves corporate areas, which need to lead by example.  Just as front line services struggle to record the value they bring to service users, so too back office functions.

    I led the NHSI sponsored national Financial Improvement Programme support when paired with Avon & Wiltshire Partnership pre-Covid.   The executive team did not shy away from back office savings, sending a clear message by down-sizing and relocating HQ.  Whilst importantly recognising the need to invest in the skills to support front line productivity improvement.

    What if savings need to be realised at pace?

    As any turnaround professional knows you have to grab the cheque book to buy time to reengineer operations.  This can be uncomfortable as it requires a command-and-control management style. 

    Vacancy panels and imposing spend controls, with far more upward delegation is very demanding on an executive team.   A necessary evil that no NHS organisation can preserve for long given the friction this generates with clinicians, who unlike a private business are not at risk of redundancy if financial rigour is not maintained.

    Conclusion

    Quality and economy go hand in hand.   To get it right first time a mental health service user needs to experience timely purposeful time limited care.  

    There cannot be compromise on this, it is an operational model weakness if services are allowed to build a waiting list that then creates the further resource burden associated with waiting list management that reduces staff time available to treat.

    Go back to the ‘wheel of fortune’ pick an operational improvement challenge, go from there to optimise value from your workforce and eliminate pressure on budgets.

    25, Jun, 2025
    Rob Stafford